MikroTik Monitoring With Munin
Written by vaheeD on January 21, 2013
Introduction
Munin is a very powerful, feature rich monitoring server based on Tobias Oetiker’s RRDTool. The monitoring server runs every 5 minutes via cron and connect to various configured nodes. Each node runs a daemon listening for connections from the server, and executes a wide range of completely customisable scripts to return data to the munin server to generate graphs from.
As the backend graphing engine is based on RRDTool, any feature available in RRDTool is also available as options to Munin. The really nice thing about Munin and RRDTool, is that negative numbers can be graphed.
In this article I will explain how to install Munin as well as Munin-Node on a single server, and how to get Munin to probe your Mikrotik devices via SNMP as well as Telnet (Depending on the type of graph). I would strongly advise that time is spend reading the Munin as well as RRDTool documentation available at the web sites, so that a clear understanding can be obtained on how Munin operates and generates graphs.
Munin Server Installation and Configuration
Munin-Server is only available in Linux format. As I use Ubuntu and FreeBSD only, I will base this installation guide on a Ubuntu Linux server. Once the general packages has been installed, the configuration should however be pretty much the same to any Munin installation, regardless of the flavour of Linux preferred.
Installing Munin
In our case, we are going to run both munin as well as munin-node on the same machine. Untill such time that (fingers crossed) we can get a munin-node integrated into Mikrotik, the node will be required to run on the same server as Munin itself for best results.
As such, and being Ubuntu, we simply install the two packages, and make sure that we meet all the requirements in terms of dependencies. Additionally, for the Mikrotik scripts below to work, we also need to install the Net::SNMP, and Net::Telnet::Cisco Perl packages.
$sudo apt-get install munin munin-node libnet-telnet-cisco-perl libnet-snmp-perl
Now that we have all that we need installed (I am presuming you have Apache / tinyHTTP Web server already installed), it’s time to head off and do some basic configurations.
Configuring the Master
First things first, we need to edit the Master’s configuration file, by default, /etc/munin/munin.conf. This is the file where you configure every munin-node that the master needs to poll. As we are using a simple model here, we are only going be to polling localhost, which is accessible via 127.0.0.1 (If it isn’t you have bigger problems than monitoring ;-) ).
Your Munin configuration should thus look something similar to below (Paths may vary on different distributions):
dbdir       /var/lib/munin/
htmldir     /var/www/munin/
logdir      /var/log/munin
rundir      /var/run/munin/

[localhost]
        address 127.0.0.1
dbdir will be the database where munin stores its internal state files, as well as the RRD database files
htmldir will be the directory where munin will greate the appropriate html files as well as png images
logdir keeps various log files of what munin is doing – useful when things don’t go as you intended
rundir munin pid files, lock files, etc. Nothing fancy here really
Additionally, we have configured one active node which munin needs to poll. Munin will connect to 127.0.0.1 on 4949/TCP (default port that munin runs on) and pull this node for any nodes and/or scripts configured to be graphed.
Configuring the Node
Whilst Munin-Node is pretty secure out of the box, there are some basic things we need to change. Even though the node only authorizes just localhost to gather data from it, it listens by default on all IP addresses. As a security measure, we are going to alter the munin-node configuration file and ensure that we are only listening on localhost for connections from the Munin Server. As such, we need to open up /etc/munin/munin-node.conf in your faviourite editor of choice.
We need to alter the Host value in order to bind munin-node to the 127.0.0.1 address. Your config should now look like this:
#host *
host 127.0.0.1
This is about all that you need to do to get Munin working. As we have modified the configurations, we need to restart the munin-node service, in Ubuntu I issue:
$ /etc/init.d/munin-node restart
Configuring Apache
Apache needs access to Munin’s htmldir configuration in order for you to see the pretty graphs and generated html in the browser of your choice. As such we need to configure some Alias and Directory settings in Apache’s configuration. This can be done either inside a Virtual Host of your choice, or in apache’s main configuration. As a example, I have elected to configure a new Apache Virtual Host which will only serve up the munin pages. The Virtual Host’s configuration will be something similar to
<VirtualHost *:80>
        ServerAdmin [email protected]
        ServerName monitor.example.com
        DocumentRoot /var/www/munin
        <Directory />
                Options FollowSymLinks
                AllowOverride None
        </Directory>
        CustomLog /var/log/apache2/monitor.example.com.access.log combined
        ErrorLog /var/log/apache2/monitor.example.com.error.log
        ServerSignature On
</VirtualHost>
Verify that your syntax of the Apache configuration file is correct (apache2ctl -t), and then restart your Apache web server to enable the newly configured Virtual Host
$ sudo apache2ctl -t
Syntax OK
$ sudo apache2ctl graceful
$
Open up your faviourite web browser, browse to http://monitor.example.com, and you should have pretty graphs for the server on which you are running munin.
Munin Node for Mikrotik
To configure Munin to monitor a Mikrotik device, is really a two step process. In a conventional configuration where Munin-Node is available on the target being monitored, we normally would only need to configure Munin to monitor the node in question, however, due to the lack of Munin on Mikrotik, we need to alias the Mikrotik node to our configured Munin-Node server in order to execute scripts on our Mikrotik device. The downside of this is that all scripts will need to be executed twice and as such scripts which use Telnet to obtain data will login two times into the routers that is being monitored.
Configuring additional Nodes in Munin
The first step in monitoring Mikrotik devices, is to configure the nodes as a alias to our locally running Munin-Node. This is done by editing the Munin-Node configuration file, by default located at /etc/munin/munin.conf. We edit this file using our faviourite editor of choice, and define the two new nodes as listed below.
The part in the brackets define the node’s name, and for sanity purposes I recommend that the FQDN always be used to make your life allot easier in the following sections. The address, will always be pointing to 127.0.0.1 as Munin needs to connect to our only real munin-node we have running on localhost.
[node1.somewhere.com]
    address 127.0.0.1

[node2.somewhere.com]
    address 127.0.0.1
Monitoring CPU Usage
Now that we have our Munin node configured, we need to configure the scripts inside Munin-Node to poll our Mikrotik Devices. This is where things get complicated, and as a example I will configure a script to monitor and graph both our router’s CPU usage. The scripts are by default located in/etc/munin/plugins/. The naming of these scripts are very important, and attention need to be given to the location as well as names.
Our CPU Monitoring script utilises SNMP, therefore, make sure that SNMP is enabled on your routers, and that the Server running munin has access to query your router via SNMP. A simple test can be performed to ensure that this is the case:
$ snmpget -v 1 -c public node1.somewhere.com .1.3.6.1.2.1.25.3.3.1.2.1
HOST-RESOURCES-MIB::hrProcessorLoad.1 = INTEGER: 5
$
Congratulations, we have just obtained our CPU usage of our router via a simple SNMP query. Should this query not be successfull, it means that Munin will be unable to query your router via SNMP, and you need to correct this before proceeding.
Now that we know SNMP queries are working like they should, we need to get a simple script operational to pull this data into Munin for monitoring… Copy the script below to query the nodes via SNMP for CPU usage, and save it in the /etc/munin/plugins directory having the specific file name of mikrotikcpu_node1.somewhere.com (where node1.somewhere.com is the same as the node name you configured earlier in /etc/munin/munin.conf). These names MUST be the same, otherwise, the scripts WILL fail.
Mikrotik CPU Usage via SNMP:
#!/usr/bin/perl
###############################################################################
use diagnostics;
use Net::SNMP;
use strict;
use warnings;
###############################################################################
my $CPUOID = ".1.3.6.1.2.1.25.3.3.1.2.1";
my $SNMPCommunity = "public";
my $SNMPPort = "161";

###############################################################################
## Determine Hostname
my $Host = undef;
$0 =~ /mikrotikcpu_(.+)*$/;
unless ($Host = $1) {
  exit 2;
}

###############################################################################
## Initiate SNMP Session
my ($Session, $Error) = Net::SNMP->session (-hostname  => $Host,
                                            -community => $SNMPCommunity,
                                            -port      => $SNMPPort,
                                            -timeout   => 60,
                                            -retries   => 5,
                                            -version   => 1);
if (!defined($Session)) {
  die "Croaking: $Error";
}

###############################################################################
## Configuration
if ($ARGV[0] && $ARGV[0] eq "config") {
  print "host_name " . $Host . "\n";
  print "graph_args -l 0 -r --vertical-label percent --lower-limit 0 --upper-limit 100\n";
  print "graph_title CPU usage\n";
  print "graph_category system\n";
  print "graph_info This graph shows the router's CPU usage.\n";
  print "graph_order Total\n";
  print "graph_vlabel %\n";
  print "graph_scale no\n";
  print "Total.label CPU Usage\n";
  print "Total.draw AREA\n";
  print "Total.warning 60\n";
  print "Total.critical 90\n";
  $Session->close;
  exit;
}

###############################################################################
## Execution
if (my $Result = $Session->get_request(-varbindlist => [$CPUOID])) {
  print "Total.value " . $Result->{$CPUOID} . "\n";
  $Session->close;
  exit;
}
Next, we need to make sure that Munin can execute the file, and that the script os operating successfully
$ chmod u+x /etc/munin/plugins/mikrotikcpu_node1.somewhere.com
$ chown munin:munin /etc/munin/plugins/mikrotikcpu_node1.somewhere.com
$ /etc/munin/plugins/mikrotikcpu_node1.somewhere.com config
host_name node1.somewhere.com
graph_args -l 0 -r --vertical-label percent --lower-limit 0 --upper-limit 100
graph_title CPU usage
graph_category system
graph_info This graph shows the router's CPU usage.
graph_order Total
graph_vlabel %
graph_scale no
Total.label CPU Usage
Total.draw AREA
Total.warning 60
Total.critical 90
Our scripts seems to be working fine. Very important, when the script is executed with the config parameter, make 100% sure that the value of the host_name configuration variable is returned correctly, and that it is identical to the name of the node configured in /etc/munin/munin.conf.
The last step is to restart our munin-node, as we have made changes to it (we added more scripts). We simply execute the restart command:
$ /etc/init.d/munin-node restart
Now that we have restarted munin-node, we can also test the configuration, and see what munin will be seeing when quering the nodes that we have configured. In order to do this, we are going to telnet into Munin-Node, and obtain the graph data ourselves. This is done by telneting to the munin-node engine, running at 127.0.0.1 port 4949 (if you didn’t change any other configurations except that mentioned in this document), and we then send the ‘nodes‘ command, which will give us a list of nodes running under the munin-node that we have configured.
$ telnet localhost 4949
Trying 127.0.0.1...
Connected to 127.0.0.1.
Escape character is '^]'.
# munin node at localhost.somewhere.com
nodes
localhost
node1.somewhere.com
node2.somewhere.com
.
It seems to be perfect. We have localhost, node1.somewhere.com, as well as node2.somewhere.com. Let’s see what plugins is available under each node. Again, we telnet into the munin-node deamon, but this time, we will execute two commands, ‘list node1.somewhere.com‘ and ‘list node2.somewhere.com‘. This will list all the plugins currently configured for these two nodes.
$ telnet 127.0.0.1 4949
Trying 127.0.0.1...
Connected to 127.0.0.1.
Escape character is '^]'.
# munin node at localhost.somewhere.com
list node1.somwehere.com
mikrotikcpu_node1.somewhere.com
list node2.somewhere.com
mikrotikcpu_node2.somewhere.com
We can see in both instances, the mikrotikcpu_ script has been configured, and is activated for both our mikrotik nodes. We can also attempt to fetch the data by executing a ‘fetch mikrotikcpu_node1.somewhere.com‘ command in munin, at which time munin-node will query the Mikrotik Router, and return the data back through Munin.
If all went well, you should by now have two additional nodes listed on the Web Interface munin has, and both these two additional nodes should have graphs indicating the CPU usage as a % value, between 0 and 100.
Available Scripts
From where on out, the installation of the scripts are pretty much the same, regardless of what you monitor or how. Each script that I have so far will be covered in the remaining sections, including details on what is required, the naming of the scripts, limitations, as well as installation instructions. As mentioned previously, if there is any monitoring not covered that you would like to see, please let me know and I will see about writing scritps to do what is required.
mikrotikcpu_
| Installation: | Quick & Easy |
| Technology Used: | SNMP |
| Sample Graph: | 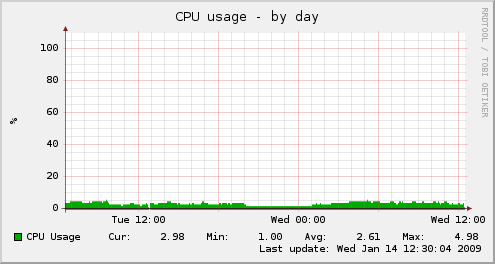 |
Script:
#!/usr/bin/perl
###############################################################################
use diagnostics;
use Net::SNMP;
use strict;
use warnings;
###############################################################################
my $CPUOID = ".1.3.6.1.2.1.25.3.3.1.2.1";
my $SNMPCommunity = "public";
my $SNMPPort = "161";

###############################################################################
## Determine Hostname
my $Host = undef;
$0 =~ /mikrotikcpu_(.+)*$/;
unless ($Host = $1) {
  exit 2;
}

###############################################################################
## Initiate SNMP Session
my ($Session, $Error) = Net::SNMP->session (-hostname  => $Host,
                                            -community => $SNMPCommunity,
                                            -port      => $SNMPPort,
                                            -timeout   => 60,
                                            -retries   => 5,
                                            -version   => 1);
if (!defined($Session)) {
  die "Croaking: $Error";
}

###############################################################################
## Configuration
if ($ARGV[0] && $ARGV[0] eq "config") {
  print "host_name " . $Host . "\n";
  print "graph_args -l 0 -r --vertical-label percent --lower-limit 0 --upper-limit 100\n";
  print "graph_title CPU usage\n";
  print "graph_category system\n";
  print "graph_info This graph shows the router's CPU usage.\n";
  print "graph_order Total\n";
  print "graph_vlabel %\n";
  print "graph_scale no\n";
  print "Total.label CPU Usage\n";
  print "Total.draw AREA\n";
  print "Total.warning 60\n";
  print "Total.critical 90\n";
  $Session->close;
  exit;
}

###############################################################################
## Execution
if (my $Result = $Session->get_request(-varbindlist => [$CPUOID])) {
  print "Total.value " . $Result->{$CPUOID} . "\n";
  $Session->close;
  exit;
}
mikrotikdiskspace_
| Installation: | Quick & Easy |
| Technology Used: | SNMP |
| Sample Graph: | 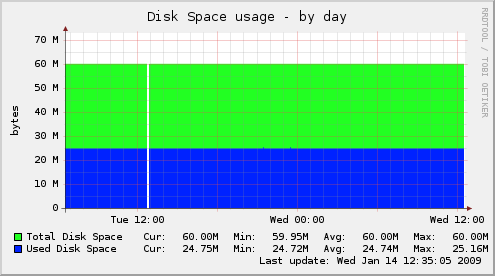 |
Script:
#!/usr/bin/perl
###############################################################################
use diagnostics;
use Net::SNMP;
use strict;
use warnings;
###############################################################################
my $DiskTotalOID = ".1.3.6.1.2.1.25.2.3.1.5.1";
my $DiskUsedOID = ".1.3.6.1.2.1.25.2.3.1.6.1";
my $SNMPCommunity = "public";
my $SNMPPort = "161";

###############################################################################
## Determine Hostname
my $Host = undef;
$0 =~ /mikrotikdiskspace_(.+)*$/;
unless ($Host = $1) {
  exit 2;
}

###############################################################################
## Initiate SNMP Session
my ($Session, $Error) = Net::SNMP->session (-hostname  => $Host,
                                            -community => $SNMPCommunity,
                                            -port      => $SNMPPort,
                                            -timeout   => 60,
                                            -retries   => 5,
                                            -version   => 1);
if (!defined($Session)) {
  die "Croaking: $Error";
}

###############################################################################
## Configuration
if ($ARGV[0] && $ARGV[0] eq "config") {
  my $Result = $Session->get_request(-varbindlist => [$DiskTotalOID]);
  print "host_name " . $Host . "\n";
  print "graph_args --base 1024 -l 0 --vertical-label Bytes --upper-limit " . ($Result->{$DiskTotalOID} * 1024) . "\n";
  print "graph_title Disk Space usage\n";
  print "graph_category system\n";
  print "graph_info This graph shows the router's Disk Space usage.\n";
  print "graph_order Total Used\n";
  print "graph_vlabel bytes\n";
  print "Total.label Total Disk Space\n";
  print "Total.draw AREA\n";
  print "Used.label Used Disk Space\n";
  print "Used.draw AREA\n";
  $Session->close;
  exit;
}

###############################################################################
## Execution
if (my $Result = $Session->get_request(-varbindlist => [$DiskTotalOID, $DiskUsedOID])) {
  print "Total.value " . ($Result->{$DiskTotalOID} * 1024) . "\n";
  print "Used.value " . ($Result->{$DiskUsedOID} * 1024) . "\n";
  $Session->close;
  exit;
}
mikrotikmemory_
| Installation: | Quick & Easy |
| Technology Used: | SNMP |
| Sample Graph: | 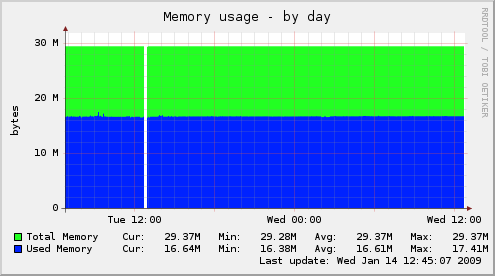 |
Script:
#!/usr/bin/perl
###############################################################################
use diagnostics;
use Net::SNMP;
use strict;
use warnings;
###############################################################################
my $MemTotalOID = ".1.3.6.1.2.1.25.2.3.1.5.2";
my $MemUsedOID = ".1.3.6.1.2.1.25.2.3.1.6.2";
my $SNMPCommunity = "public";
my $SNMPPort = "161";

###############################################################################
## Determine Hostname
my $Host = undef;
$0 =~ /mikrotikmemory_(.+)*$/;
unless ($Host = $1) {
  exit 2;
}

###############################################################################
## Initiate SNMP Session
my ($Session, $Error) = Net::SNMP->session (-hostname  => $Host,
                                            -community => $SNMPCommunity,
                                            -port      => $SNMPPort,
                                            -timeout   => 60,
                                            -retries   => 5,
                                            -version   => 1);
if (!defined($Session)) {
  die "Croaking: $Error";
}

###############################################################################
## Configuration
if ($ARGV[0] && $ARGV[0] eq "config") {
  my $Result = $Session->get_request(-varbindlist => [$MemTotalOID]);
  print "host_name " . $Host . "\n";
  print "graph_args --base 1024 -l 0 --vertical-label Bytes --upper-limit " . ($Result->{$MemTotalOID} * 1024) . "\n";
  print "graph_title Memory usage\n";
  print "graph_category system\n";
  print "graph_info This graph shows the router's memory usage.\n";
  print "graph_order Total Used\n";
  print "graph_vlabel bytes\n";
  print "Total.label Total Memory\n";
  print "Total.draw AREA\n";
  print "Used.label Used Memory\n";
  print "Used.draw AREA\n";
  $Session->close;
  exit;
}

###############################################################################
## Execution
if (my $Result = $Session->get_request(-varbindlist => [$MemTotalOID, $MemUsedOID])) {
  print "Total.value " . ($Result->{$MemTotalOID} * 1024) . "\n";
  print "Used.value " . ($Result->{$MemUsedOID} * 1024) . "\n";
  $Session->close;
  exit;
}
mikrotikppp_
| Installation: | Easy to Intermediate |
| Technology Used: | Telnet (RO Access, Single Login) |
| Sample Graph: | 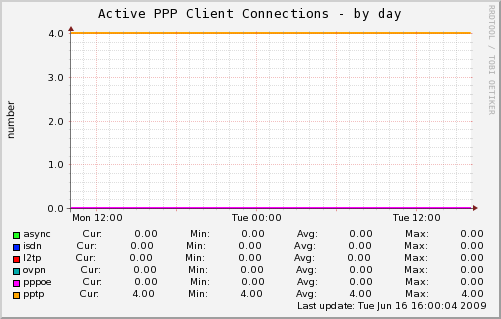 |
Script:
#!/usr/bin/perl
#
# Beware - some perl Net::Telnet::Cisco packages are broken and you may need
# to manually hack a 'g' out of a file if you get an error message!
# Nick Barnes 20090610
#
###############################################################################
use diagnostics;
use Net::Telnet::Cisco;
use strict;
use warnings;
##############################################################################
my $TelnetPort = "23";
my $TelnetUser = "username";
my $TelnetPass = "password";

###############################################################################
## Determine Hostname
my $Host = undef;
$0 =~ /mikrotikppp_(.+)*$/;
unless ($Host = $1) {
  exit 2;
}

###############################################################################
## Initiate Telnet Session
my $MT = Net::Telnet::Cisco->new(Host    => $Host,
                                 Port    => $TelnetPort,
                                 Prompt  => '/[\>\#] $/',
                                 Timeout => 30);

###############################################################################
## Configuration
if ($ARGV[0] && $ARGV[0] eq "config") {
  print "host_name " . $Host . "\n";
  print "graph_args --base 1000 -l 0 -r --lower-limit 0\n";
  print "graph_title Active PPP Client Connections\n";
  print "graph_vlabel number\n";
  print "graph_category network\n";
  print "graph_info This graph shows the active amount of ppp connections\n";
  print "graph_order async isdn l2tp ovpn pppoe pptp\n";
  print "async.label async\n";
  print "async.info ASync Connections\n";
  print "isdn.label isdn\n";
  print "isdn.info ISDN Connections\n";
  print "l2tp.label l2tp\n";
  print "l2tp.info L2TP Connections\n";
  print "ovpn.label ovpn\n";
  print "ovpn.info OVPN Connections\n";
  print "pppoe.label pppoe\n";
  print "pppoe.info PPPoE Connections\n";
  print "pptp.label pptp\n";
  print "pptp.info PPTP Connections\n";
  exit;
}

###############################################################################
## Execution
if (!defined($MT->login($TelnetUser . "+ct", $TelnetPass))) {
  die "Croaking: $MT->error";
} else {
  my $async = 0;
  my $isdn = 0;
  my $ltp = 0;
  my $ovpn = 0;
  my $pppoe = 0;
  my $pptp = 0;
  my @Output = $MT->cmd("/ppp active print without-paging terse");
  foreach my $Line (@Output) {
    my ($tmp, $rest) = split(/ name/, $Line, 2);
    if ($rest && $rest =~ /async/ ) { $async++; };
    if ($rest && $rest =~ /isdn/ ) { $isdn++; };
    if ($rest && $rest =~ /l2tp/ ) { $ltp++; };
    if ($rest && $rest =~ /ovpn/ ) { $ovpn++; };
    if ($rest && $rest =~ /pppoe/ ) { $pppoe++; };
    if ($rest && $rest =~ /pptp/ ) { $pptp++; };
  }
  print "async.value " . $async . "\n";
  print "isdn.value " . $isdn . "\n";
  print "l2tp.value " . $ltp . "\n";
  print "ovpn.value " . $ovpn . "\n";
  print "pppoe.value " . $pppoe . "\n";
  print "pptp.value " . $pptp . "\n";
  exit;
}
mikrotikradius_
| Installation: | Easy to Intermediate |
| Technology Used: | Telnet (RO Access, Single Login) |
| Sample Graph: | 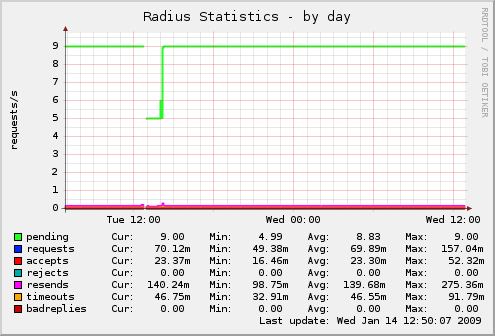 |
Script:
#!/usr/bin/perl
###############################################################################
use diagnostics;
use Net::Telnet::Cisco;
use strict;
use warnings;
###############################################################################
my $RadiusHost = "192.168.1.251";       ## This is the address of the Radius
                                        ## Server we monitor as configured in
                                        ## /radius on Mikrotik
my $TelnetPort = "23";
my $TelnetUser = "username";
my $TelnetPass = "password";

###############################################################################
## Determine Hostname
my $Host = undef;
$0 =~ /mikrotikradius_(.+)*$/;
unless ($Host = $1) {
  exit 2;
}

###############################################################################
## Initiate Telnet Session
my $MT = Net::Telnet::Cisco->new(Host    => $Host,
                                 Port    => $TelnetPort,
                                 Prompt  => '/[\>\#] $/',
                                 Timeout => 30);
if (!defined($MT->login($TelnetUser . "+ct", $TelnetPass))) {
  die "Croaking: $MT->error";
}

###############################################################################
## Configuration
if ($ARGV[0] && $ARGV[0] eq "config") {
  print "host_name " . $Host . "\n";
  print "graph_args --base 1000 -l 0 -r --lower-limit 0\n";
  print "graph_title Radius Statistics\n";
  print "graph_vlabel requests/s\n";
  print "graph_category system\n";
  print "graph_info This graph shows Radius usage.\n";
  print "graph_period second\n";
  print "graph_order pending requests accepts rejects resends timeouts badreplies\n";
  print "pending.label pending\n";
  print "pending.info Requests Pending\n";
  print "requests.label requests\n";
  print "requests.info Requests Completed\n";
  print "requests.type COUNTER\n";
  print "accepts.label accepts\n";
  print "accepts.info Authentication Accepted\n";
  print "accepts.type COUNTER\n";
  print "rejects.label rejects\n";
  print "rejects.info Authentication Rejected\n";
  print "rejects.type COUNTER\n";
  print "resends.label resends\n";
  print "resends.info Request Resends\n";
  print "resends.type COUNTER\n";
  print "timeouts.label timeouts\n";
  print "timeouts.info Request Timeouts\n";
  print "timeouts.type COUNTER\n";
  print "badreplies.label badreplies\n";
  print "badreplies.info Bad Replies\n";
  print "badreplies.type COUNTER\n";
  exit;
}

###############################################################################
## Execution
my ($tmp, $pending, $requests, $accepts, $rejects, $resends, $timeouts, $badreplies, $rtt) = undef;
my @Output = $MT->cmd("/radius monitor [find address=" . $RadiusHost . "] once");
foreach my $Line (@Output) {
  if ($Line =~ /pending/) {
    ($tmp, $pending) = split(/: /, $Line, 2);
  } elsif ($Line =~ /requests/) {
    ($tmp, $requests) = split(/: /, $Line, 2);
  } elsif ($Line =~ /accepts/) {
    ($tmp, $accepts) = split(/: /, $Line, 2);
  } elsif ($Line =~ /rejects/) {
    ($tmp, $rejects) = split(/: /, $Line, 2);
  } elsif ($Line =~ /resends/) {
    ($tmp, $resends) = split(/: /, $Line, 2);
  } elsif ($Line =~ /timeouts/) {
    ($tmp, $timeouts) = split(/: /, $Line, 2);
  } elsif ($Line =~ /bad-replies/) {
    ($tmp, $badreplies) = split(/: /, $Line, 2);
  }
}
print "pending.value " . $pending;
print "requests.value " . $requests;
print "accepts.value " . $accepts;
print "rejects.value " . $rejects;
print "resends.value " . $resends;
print "timeouts.value " . $timeouts;
print "badreplies.value " . $badreplies;
mikrotikroutes_
| Installation: | Easy to Intermediate |
| Technology Used: | Telnet (RO Access, Single Login) |
| Sample Graph: | 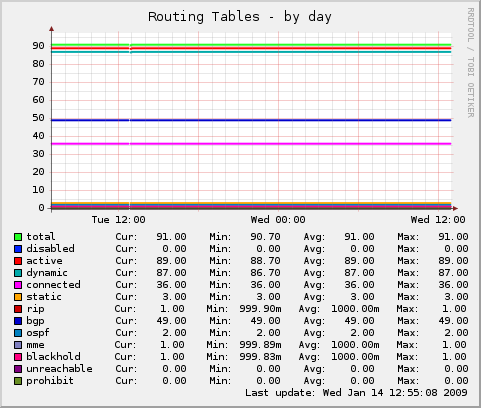 |
Script:
#!/usr/bin/perl
###############################################################################
use diagnostics;
use Net::Telnet::Cisco;
use strict;
use warnings;
##############################################################################
my ($total, $disabled, $active, $dynamic, $connected, $static, $rip, $bgp, $ospf, $mme, $blackhole, $unreachable, $prohibit) = undef;
my $TelnetPort = "23";
my $TelnetUser = "username";
my $TelnetPass = "password";

###############################################################################
## Determine Hostname
my $Host = undef;
$0 =~ /mikrotikroutes_(.+)*$/;
unless ($Host = $1) {
  exit 2;
}

###############################################################################
## Initiate Telnet Session
my $MT = Net::Telnet::Cisco->new(Host    => $Host,
                                 Port    => $TelnetPort,
                                 Prompt  => '/[\>\#] $/',
                                 Timeout => 30);

###############################################################################
## Configuration
if ($ARGV[0] && $ARGV[0] eq "config") {
  print "host_name " . $Host . "\n";
  print "graph_args --base 1000 -l 0 -r --lower-limit 0\n";
  print "graph_title Routing Tables\n";
  print "graph_vlabel number\n";
  print "graph_category network\n";
  print "graph_info This graph shows the routing table size\n";
  print "graph_order total disabled active dynamic connected static rip bgp ospf mme blackhole unreachable prohibit\n";
  print "total.label total\n";
  print "total.info Total Routes\n";
  print "disabled.label disabled\n";
  print "disabled.info Total Disabled Routes\n";
  print "active.label active\n";
  print "active.info Total Active Routes\n";
  print "dynamic.label dynamic\n";
  print "dynamic.info Total Dynamic Routes\n";
  print "connected.label connected\n";
  print "connected.info Total Connected Routes\n";
  print "static.label static\n";
  print "static.info Total Static Routes\n";
  print "rip.label rip\n";
  print "rip.info Routes obtained via RIP\n";
  print "bgp.label bgp\n";
  print "bgp.info Routes obtained via BGP\n";
  print "ospf.label ospf\n";
  print "ospf.info Routes obtained via OSPF\n";
  print "mme.label mme\n";
  print "mme.info Routes obtained via MME\n";
  print "blackhole.label blackhold\n";
  print "blackhole.info Blackhole Routes\n";
  print "unreachable.label unreachable\n";
  print "unreachable.info Routes currently unreachable\n";
  print "prohibit.label prohibit\n";
  print "prohibit.info Prohibited routes\n";
  exit;
}

###############################################################################
## Execution
if (!defined($MT->login($TelnetUser . "+ct", $TelnetPass))) {
  die "Croaking: $MT->error";
} else {
  my @Output = $MT->cmd("/ip route print without-paging terse");
  $total = 0;
  $disabled = 0;
  $active = 0;
  $dynamic = 0;
  $connected = 0;
  $static = 0;
  $rip = 0;
  $bgp = 0;
  $ospf = 0;
  $mme = 0;
  $blackhole = 0;
  $unreachable = 0;
  $prohibit = 0;

  foreach my $Line (@Output) {
    $total = $total + 1;
    my ($tmp, $rest) = split(/  /, $Line, 2);
    if ($tmp && $tmp =~ /X/) {$disabled = $disabled + 1;}
    if ($tmp && $tmp =~ /A/) {$active = $active + 1;}
    if ($tmp && $tmp =~ /D/) {$dynamic = $dynamic + 1;}
    if ($tmp && $tmp =~ /C/) {$connected = $connected + 1;}
    if ($tmp && $tmp =~ /S/) {$static = $static + 1;}
    if ($tmp && $tmp =~ /r/) {$rip = $rip + 1;}
    if ($tmp && $tmp =~ /b/) {$bgp = $bgp + 1;}
    if ($tmp && $tmp =~ /o/) {$ospf = $ospf + 1;}
    if ($tmp && $tmp =~ /m/) {$mme = $mme + 1;}
    if ($tmp && $tmp =~ /B/) {$blackhole = $blackhole + 1;}
    if ($tmp && $tmp =~ /U/) {$unreachable = $unreachable + 1;}
    if ($tmp && $tmp =~ /P/) {$prohibit = $prohibit + 1;}
  }
  print "total.value " . $total . "\n";
  print "disabled.value " . $disabled . "\n";
  print "active.value " . $active . "\n";
  print "dynamic.value " . $dynamic . "\n";
  print "connected.value " . $connected . "\n";
  print "static.value " . $static . "\n";
  print "rip.value " . $rip . "\n";
  print "bgp.value " . $bgp . "\n";
  print "ospf.value " . $ospf . "\n";
  print "mme.value " . $mme . "\n";
  print "blackhole.value " . $blackhole . "\n";
  print "unreachable.value " . $unreachable . "\n";
  print "prohibit.value " . $prohibit . "\n";
  exit;
}
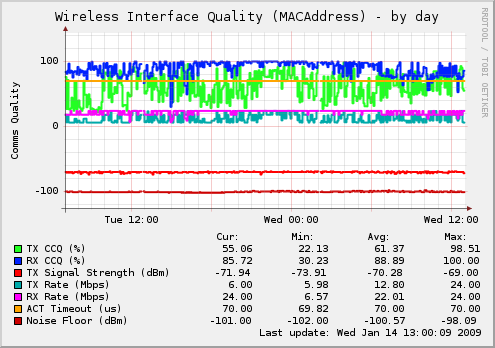
mikrotikwirelessinterface_
Script:
#!/usr/bin/perl
###############################################################################
use diagnostics;
use Net::Telnet::Cisco;
use strict;
use warnings;
##############################################################################
my $TelnetPort = "23";
my $TelnetUser = "username";
my $TelnetPass = "password";

###############################################################################
## Determine Hostname
my $Host = undef;
$0 =~ /mikrotikwirelessinterface_(.+)*$/;
unless ($Host = $1) {
  exit 2;
}

###############################################################################
## Initiate Telnet Session
my $MT = Net::Telnet::Cisco->new(Host    => $Host,
                                 Port    => $TelnetPort,
                                 Prompt  => '/[\>\#] $/',
                                 Timeout => 30);

###############################################################################
## Configuration
if ($ARGV[0] && $ARGV[0] eq "config") {
  print "host_name " . $Host . "\n";
  print "graph_args -l 0 --lower-limit -100 --upper-limit 100\n";
  print "graph_title Wireless Interface Quality (MACAddress)\n";
  print "graph_vlabel Comms Quality\n";
  print "graph_category network\n";
  print "graph_info This graph shows the wireless interface statistics\n";
  print "graph_order txccq rxccq txsignal txrate rxrate acttimeout noisefloor\n";
  print "graph_scale no\n";
  print "txccq.label TX CCQ (%)\n";
  print "rxccq.label RX CCQ (%)\n";
  print "txsignal.label TX Signal Strength (dBm)\n";
  print "acttimeout.label ACT Timeout (us)\n";
  print "noisefloor.label Noise Floor (dBm)\n";
  print "txrate.label TX Rate (Mbps)\n";
  print "rxrate.label RX Rate (Mbps)\n";
  exit;
}

###############################################################################
## Execution
if (!defined($MT->login($TelnetUser . "+ct", $TelnetPass))) {
  die "Croaking: $MT->error";
} else {
  my @Output = $MT->cmd("/interface wireless monitor 0 once\nD\n");
  my ($rest, $tmp, $txccq, $rxccq, $txsignal, $stn, $otxccq, $acttimeout, $noisefloor, $txrate, $rxrate) = undef;
  foreach my $Line (@Output) {
    if (($Line =~ /tx-ccq/ && $Line !~ /overall-tx-ccq/) && $Line =~ m/(\d+)/) {
      $txccq = $1;
    }
    if ($Line =~ /rx-ccq/ && $Line =~ m/(\d+)/) {
      $rxccq = $1;
    }
    if ($Line =~ /tx-signal-strength/ && $Line =~ m/(.\d+)/) {
      $txsignal = $1;
    }
    if ($Line =~ /current-ack-timeout/ && $Line =~ m/(.\d+)/) {
      $acttimeout = $1;
    }
    if ($Line =~ /noise-floor/ && $Line =~ m/(.\d+)/) {
      $noisefloor = $1;
    }
    if ($Line =~ /tx-rate/ && $Line =~ m/(\d+)/) {
      $txrate = $1;
    }
    if ($Line =~ /rx-rate/ && $Line =~ m/(\d+)/) {
      $rxrate = $1;
    }
  }
  print "txccq.value " . $txccq . "\n";
  print "rxccq.value " . $rxccq . "\n";
  print "txsignal.value " . $txsignal . "\n";
  print "acttimeout.value " . $acttimeout . "\n";
  print "noisefloor.value " . $noisefloor . "\n";
  print "txrate.value " . $txrate . "\n";
  print "rxrate.value " . $rxrate . "\n";
  exit;
}
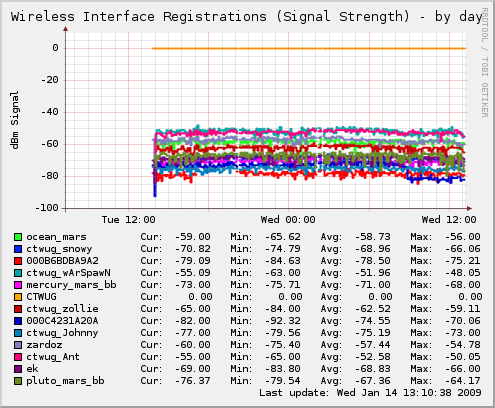
mikrotikwirelessregistration_
Script:
#!/usr/bin/perl
###############################################################################
use diagnostics;
use Net::Telnet::Cisco;
use strict;
use warnings;
##############################################################################
my @Output = undef;
my $TelnetPort = "23";
my $TelnetUser = "username";
my $TelnetPass = "password";

###############################################################################
## Determine Hostname
my $Host = undef;
$0 =~ /mikrotikwirelessregistration_(.+)*$/;
unless ($Host = $1) {
  exit 2;
}

###############################################################################
## Initiate Telnet Session
my $MT = Net::Telnet::Cisco->new(Host    => $Host,
                                 Port    => $TelnetPort,
                                 Prompt  => '/[\>\#] $/',
                                 Timeout => 30);
if (!defined($MT->login($TelnetUser . "+ct", $TelnetPass))) {
  die "Croaking: $MT->error";
}

###############################################################################
## Configuration
if ($ARGV[0] && $ARGV[0] eq "config") {
  print "host_name " . $Host . "\n";
  print "graph_args -l 0 --lower-limit -100 --upper-limit 0\n";
  print "graph_title Wireless Interface Registrations (Signal Strength)\n";
  print "graph_vlabel dBm Signal\n";
  print "graph_category network\n";
  print "graph_info This graph shows the wireless registration signal strength\n";
  print "graph_scale no\n";
  @Output = $MT->cmd("/interface wireless registration-table print without-paging");
  foreach my $Line (@Output) {
    my ($tmp, $number, $interface, $radio, $mac, $ap, $signal, $txrate, $uptime) = split(/\s+/, $Line, 9);
    if ($interface && $interface ne "INTERFACE") {
      print $interface . ".label " . $interface . "\n";
    }
  }
  exit;
}

###############################################################################
## Execution
@Output = $MT->cmd("/interface wireless registration-table print without-paging");
foreach my $Line (@Output) {
  my ($tmp, $number, $interface, $radio, $mac, $ap, $signal, $txrate, $uptime) = split(/\s+/, $Line, 9);
  if ($interface && $interface ne "INTERFACE") {
    if ($signal =~ m/(.\d+)/) {
      print $interface . ".value " . $1 . "\n";
    }
  }
}
exit;
—Savage 14:02, 14 January 2009 (EET)
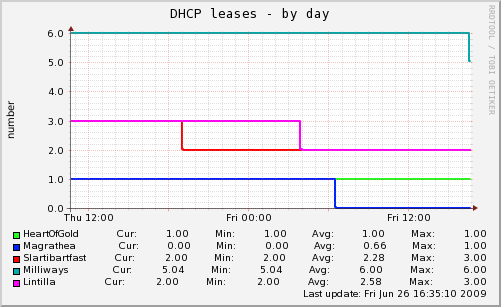
mikrotikdhcpleases_
Script:
#!/usr/bin/php
<?php

// Change the following path as appropriate
require('/var/www/html/ros/routeros_api.class.php');

$API = new routeros_api();

// debug
$API->debug = false;

// Work out which hostname we're connecting to.
$hostname = explode("_",$argv[0],2);

if (isset($hostname[1])) {
  $hostname = $hostname[1];
} else {
  die("No hostname available");
}

// First things first, get the information we want to look at
// change username/password as appropriate
if ($API->connect($hostname, 'munin', 'munin')) {

   $API->write('/ip/dhcp-server/getall');
   $dhcp_servers = $API->read();

// Not very optimal - we get the leases even if we don't need them, but it'll do for the moment.
   $API->write('/ip/dhcp-server/lease/getall');
   $dhcp_leases = $API->read();

   $API->disconnect();

   $connect = 'yes';
} else {
   $connect = 'no (could not connect)';
}

if ($argc > 1 && $argv[1] == 'autoconf') {
  print $connect . "\n";
  exit;
}

//Output configuration information
if ($argc > 1 && $argv[1] == 'config') {
  print "host_name $hostname\n";
  print "graph_args --base 1000 -l 0 -r --lower-limit 0\n";
  print "graph_title DHCP leases\n";
  print "graph_vlabel number\n";
  print "graph_category network\n";
  print "graph_info This graph shows the number of active leases for each DHCP server\n";
  print "graph_scale no\n";
  if (!empty($dhcp_servers)) {
    foreach ($dhcp_servers as $value) {
      $nicename=ereg_replace("[^A-Za-z0-9]", "",$value["name"]);
      print $nicename . ".label " . $value["name"] . "\n";
    }
  }
  exit;
}

// Exit if we don't have any servers to report on.
if (empty($dhcp_servers)) {
  exit;
}

// Set count for each server to zero.
foreach ($dhcp_servers as $value) {
  $dhcp_server_leases[$value["name"]]=0 ;
}

// Then calculate the count for each server.
if (!empty($dhcp_leases)) {
  foreach ($dhcp_leases as $value) {
    if (array_key_exists("active-server",$value)) {
      $dhcp_server_leases[$value["active-server"]]+=1;
    }
  }
}

// Finally, print it all out.
foreach ($dhcp_server_leases as $key => $value) {
  print ereg_replace("[^A-Za-z0-9]", "",$key) . ".value " . $value . "\n";
}

exit;

?>
mikrotikfirewallrules_
| Installation: | Advanced |
| Technology Used: | API (PHP) |
| Notes: | Produces a graph which shows the number of active firewall rules for each chain. |
| Sample Graph: | 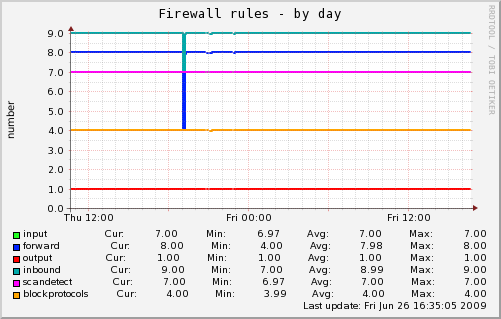 |
Script:
#!/usr/bin/php
<?php

require('/var/www/html/ros/routeros_api.class.php');

$API = new routeros_api();

// debug
$API->debug = false;

// Work out which hostname we're connecting to.
$hostname = explode("_",$argv[0],2);

if (isset($hostname[1])) {
  $hostname = $hostname[1];
} else {
  die("No hostname available");
}

// First things first, get the information we want to look at
if ($API->connect($hostname, 'munin', 'munin')) {

   $API->write('/ip/firewall/filter/getall');
   $firewall_rules = $API->read();

   $API->disconnect();

   $rulecount=array();

   foreach ($firewall_rules as $value) {

// Some versions of ROS use disabled=true, others use invalid=true
     if ((array_key_exists("disabled",$value) && $value["disabled"] == 'false') ||
     (array_key_exists("invalid",$value) && $value["invalid"] == 'false')) {
       if (array_key_exists($value["chain"],$rulecount)) {
         $rulecount[$value["chain"]] += 1;
       } else {
         $rulecount[$value["chain"]] = 1;
       }
     }
   }

   $connect = 'yes';
} else {
   $connect = 'no (could not connect)';
}

if ($argc > 1 && $argv[1] == 'autoconf') {
  print $connect . "\n";
  exit;
}

if ($argc > 1 && $argv[1] == 'config') {
  print "host_name $hostname\n";
  print "graph_args --base 1000 -l 0 -r --lower-limit 0\n";
  print "graph_title Firewall rules\n";
  print "graph_vlabel number\n";
  print "graph_category network\n";
  print "graph_info This graph shows the number of active firewall rules in each chain\n";
  print "graph_scale no\n";

  if (!empty($rulecount)) {
    foreach ($rulecount as $key => $value) {
      print $key . ".label " . $key . "\n";
    }
  }
  exit;
}

if (empty($rulecount)) {
  exit;
}

foreach ($rulecount as $key => $value) {
  print $key . ".value " . $value . "\n";
}

exit;

?>
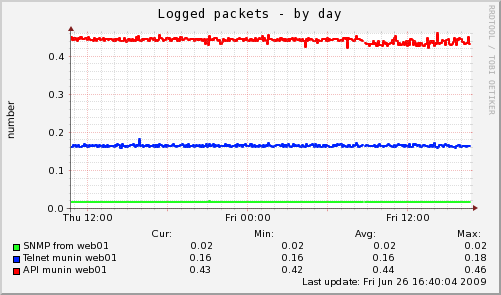
mikrotikfirewallcount_
Script:
#!/usr/bin/php
<?php

require('/var/www/html/ros/routeros_api.class.php');

$API = new routeros_api();

// debug
$API->debug = false;

// Work out which hostname we're connecting to.
$hostname = explode("_",$argv[0],2);

if (isset($hostname[1])) {
  $hostname = $hostname[1];
} else {
  die("No hostname available");
}

// First things first, get the information we want to look at
if ($API->connect($hostname, 'munin', 'munin')) {

   $API->write('/ip/firewall/filter/getall');
   $firewall_rules = $API->read();

   $API->disconnect();

   $graphme=array();

   foreach ($firewall_rules as $value) {
     if (array_key_exists("comment",$value)) {
       $comment = explode(" - ",$value["comment"]);
       if ($comment[0] == "GRAPH" && isset($comment[1])) {
         $id=ereg_replace("[^A-Za-z0-9]", "",$value[".id"]);
         $graphme[$id]["name"]=$comment[1];
         $graphme[$id]["packets"]=$value["packets"];
       }
     }
   }

   $connect = 'yes';
} else {
   $connect = 'no (could not connect)';
}

if ($argc > 1 && $argv[1] == 'autoconf') {
  print $connect . "\n";
  exit;
}

if ($argc > 1 && $argv[1] == 'config') {
  print "host_name $hostname\n";
  print "graph_args --base 1000 -l 0 -r --lower-limit 0\n";
  print "graph_title Logged packets \n";
  print "graph_vlabel number\n";
  print "graph_category firewall\n";
  print "graph_info This graph shows the number of packets for logged firewall rules\n";
  print "graph_scale no\n";

  if (!empty($graphme)) {
    foreach ($graphme as $key => $value) {
      $id=ereg_replace("[^A-Za-z0-9]", "",$key);
      print $id . ".label " . $value["name"] . "\n";
      print $id . ".type COUNTER\n";
    }
  }
  exit;
}

// If there's nothing to graph, don't bother.
if (empty($graphme)) {
  exit;
}

foreach ($graphme as $key => $value) {
  print $key . ".value " . $value["packets"] . "\n";
}

exit;

?>
mikrotikifrate_
Script:
#!/usr/bin/php
<?php

// Change the following path as appropriate
require('/var/www/html/ros/routeros_api.class.php');

$API = new routeros_api();

// debug
$API->debug = false;

// Work out hostname and interface name
$param = explode("_",$argv[0],3);

if (isset($param[1])) {
  $hostname = $param[1];
} else {
  die("No hostname available. Filename should be like: mikrotikifrate_example.changeip.net_ether1");
}

if (isset($param[2])) {
  $ifname = $param[2];
} else {
  die("No interface name available. Filename should be like: mikrotikifrate_example.changeip.net_ether1");
}

// change username/password as appropriate
if ($API->connect($hostname, 'munin', 'munin')) {

   $API->write('/interface/print',false);
   $API->write('=stats=');

   $READ = $API->read(false);
   $interfaces = $API->parse_response($READ);

   $API->disconnect();

   $connect = 'yes';
} else {
   $connect = 'no (could not connect)';
}

if ($argc > 1 && $argv[1] == 'autoconf') {
  print $connect . "\n";
  exit;
}

// Output configuration information
if ($argc > 1 && $argv[1] == 'config') {
  print "host_name $hostname\n";
  print "graph_args --base 1000\n";
  print "graph_title $ifname traffic\n";
  print "graph_vlabel bits per second\n";
  print "graph_category network\n";
  print "graph_info This graph shows the incoming and outgoing traffic rate of an interface\n";
  print "in.label received\n";
  print "in.type DERIVE\n";
  print "in.draw AREA\n";
  print "in.min 0\n";
  print "in.cdef in,8,*\n";
  print "out.label sent\n";
  print "out.type DERIVE\n";
  print "out.draw LINE1\n";
  print "out.min 0\n";
  print "out.cdef out,8,*\n";

  exit;
}

// Exit if we don't have any servers to report on.
if (empty($interfaces)) {
  exit;
}

// Finally, print it all out.
    foreach ($interfaces as $interface)
    {
	if ($interface['name']==$ifname)
	{
	    //print_r($interface);
	    $bytes = explode("/", $interface['bytes']);
	    print ("in.value ") . $bytes[0] . "\n";
	    print ("out.value ") . $bytes[1] . "\n";
	}
    }

exit;

?>
mikrotikwirelessconnected_
Script:
#!/usr/bin/perl
###############################################################################
use diagnostics;
use Net::Telnet::Cisco;
use strict;
use warnings;
##############################################################################
my $TelnetPort = "23";
my $TelnetUser = "munin";
my $TelnetPass = "password";

###############################################################################
## Determine Hostname
my $Host = undef;
$0 =~ /mikrotikwirelessconnected_(.+)*$/;
unless ($Host = $1) {
  exit 2;
}

###############################################################################
## Initiate Telnet Session
my $MT = Net::Telnet::Cisco->new(Host    => $Host,
                                 Port    => $TelnetPort,
                                 Prompt  => '/[\>\#] $/',
                                 Timeout => 30);

###############################################################################
## Configuration
if ($ARGV[0] && $ARGV[0] eq "config") {
  print "host_name " . $Host . "\n";
  print "graph_args -l 0 --lower-limit 0 --upper-limit 40\n";
  print "graph_title Wireless clients in " . $Host . " \n";
  print "graph_vlabel Number of clients\n";
  print "graph_category network\n";
  print "graph_info This graph shows the number of clients connected at the interfaces Wireless\n";
  # Pega num interfaces para grafico
  if (!defined($MT->login($TelnetUser . "+ct", $TelnetPass))) {
    die "Croaking: $MT->error";
    } else {
      # Pega o numero de interfaces na AP
	  # Gets the number of interfaces in AP
      my @interfaces = $MT->cmd("/interface wireless print count-only\nD\n");
      my ($count,$int,$cli_online,$inter_number) = undef;

      $count = 0;
      foreach my $Line (@interfaces) {
        if ( $Line =~ m/([0-9]\n)/ && $count<1 ){
          $int = $1;
          $count = $count+1;
        }
      }

      print "graph_order";
      $inter_number = 1;
      for ($count=1;$count<=$int;$count++){
          print " cl_on_wlan" . $inter_number ."";
          $inter_number = $count +1;
      }
      print "\n";

      for ($count=1;$count<=$int;$count++){
        $inter_number = $count ;
        print "cl_on_wlan" . $inter_number . ".warning 25\n";
        print "cl_on_wlan" . $inter_number . ".critical 30\n";
        print "cl_on_wlan" . $inter_number . ".label WLAN". $inter_number . "\n";
        print "cl_on_wlan" . $inter_number . ".info WIRELESS LAN " . $inter_number . "\n";
      }

    }
  exit;
}

###############################################################################
## Execution
if (!defined($MT->login($TelnetUser . "+ct", $TelnetPass))) {
  die "Croaking: $MT->error";
  } else {

  # Pega o numero de interfaces na AP
  # Gets the number of interfaces in AP
  my @interfaces = $MT->cmd("/interface wireless print count-only\nD\n");
  my ($count,$int) = undef;

  $count = 0;
  foreach my $Line (@interfaces) {
  if ( $Line =~ m/([0-9]\n)/ && $count<1 ){
        $int = $1;
        $count = $count+1;
    }
  }

# Pega o número de clientes para cada interface
# Gets the number of customers for each interface
for ($count = 0; $count < $int; $count++) {
  my @Output = $MT->cmd("/interface wireless monitor " . $count . " once\nD\n");
  my ($rest, $tmp, $cli_online, $inter_number, $cl_on_wlan14) = undef;
  foreach my $Line (@Output) {
  # Pega clientes registrados
    if ($Line =~ /registered-clients/ && $Line =~ m/(\d+)/) {
        $cli_online = $1;
        $inter_number = $count+1;
        print "cl_on_wlan" . $inter_number . ".value " . $1 . "\n";
    }
  }
  print "cl_on_wlan" . $inter_number . ".value " . $cli_online . "\n";
  }
  exit;
}
REFERENCE : MikroTik wiki
